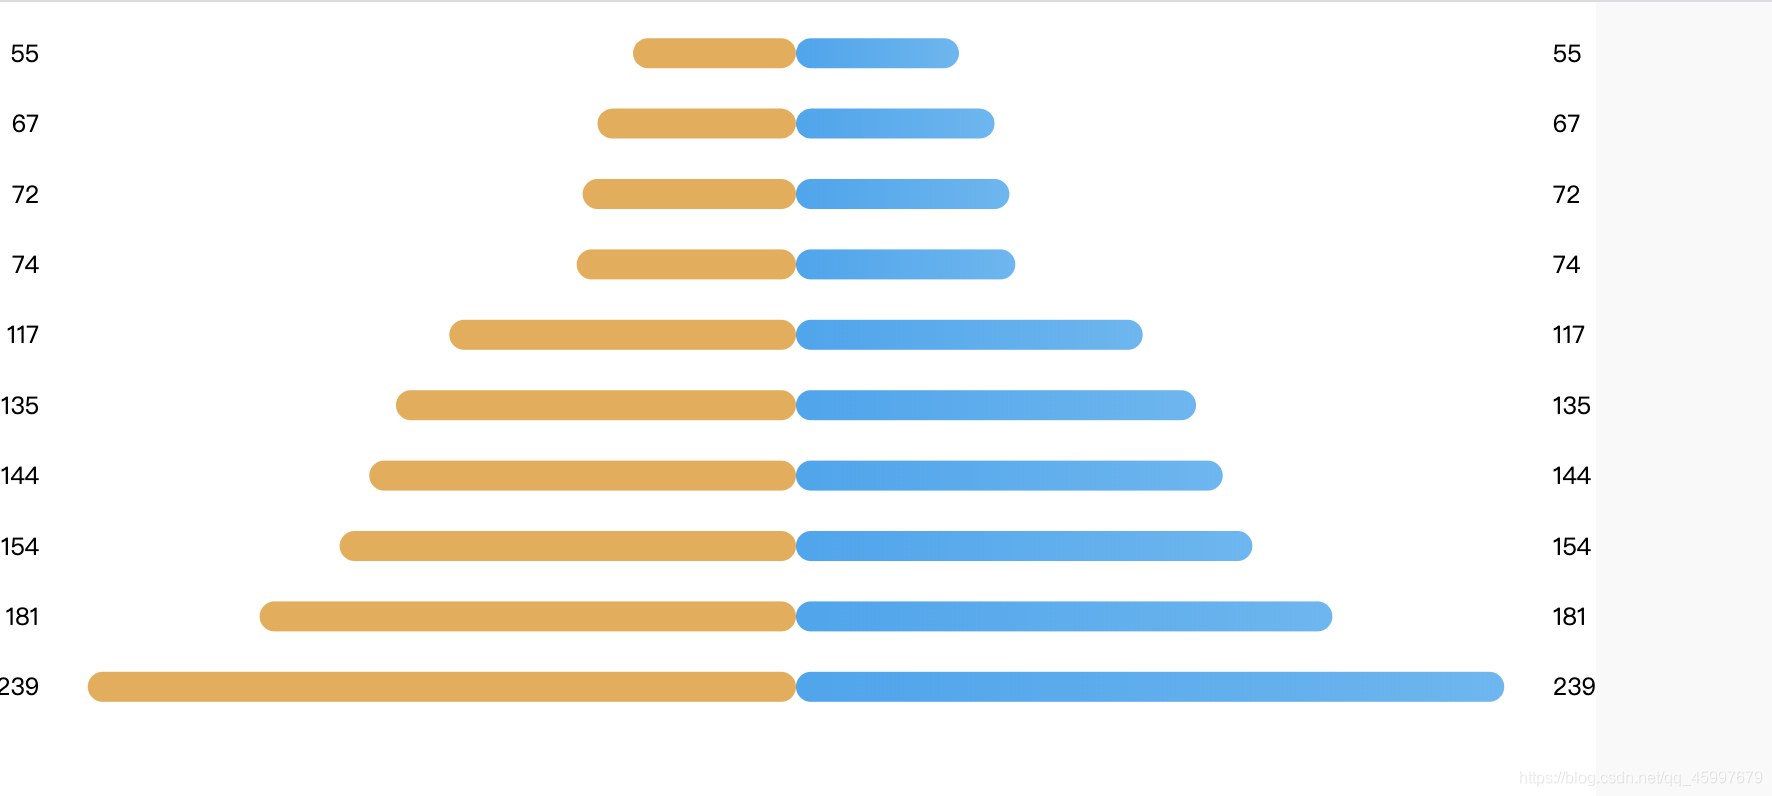
ECharts——双向柱状图
发布日期:2021-05-07 23:20:46
浏览次数:10
分类:原创文章
本文共 6070 字,大约阅读时间需要 20 分钟。
<!DOCTYPE html><html><head> @include('./header.html', { "title": "首页" }) </head><body> <div class="wrap"> <div id="echart_test2"></div> <div id="echart_test"></div> </div> <script src="dist/js/lib/jquery/jquery-3.3.1.min.js"></script> <script src="dist/js/lib/echarts/echarts-4.2.1.min.js"></script> <style> #echart_test { display: inline-block; width: 400px; height: 400px; } #echart_test2 { display: inline-block; width: 400px; height: 400px; } </style></body><script> var sechart2 = echarts.init(document.getElementById('echart_test')); // var salvProName = ["安徽省", "河南省", "浙江省", "湖北省", "贵州省", "江西省", "江苏省", "四川省", "云南省", "湖南省"]; var salvProValue = [55, 67, 72, 74, 117, 135, 144, 154, 181, 239]; var salvProMax = []; //背景按最大值 for (let i = 0; i < salvProValue.length; i++) { salvProMax.push(salvProValue[0]) } option = { backgroundColor: "white", //设置背景颜色 grid: { left: '0%', //设置左边距 right: '0%', bottom: '5%', //设置条状间距 top: '2%', //设置顶部间距 containLabel: true }, tooltip: { // trigger: 'axis', //条状图阴影是否显示 // show: true, axisPointer: { // type: 'shadow' //添加条状阴影 }, formatter: function(params) { return params[0].name + ' : ' + params[0].value } }, xAxis: { show: false, //Y轴 type: 'value' }, yAxis: [{ type: 'category', inverse: true, // 显示顺序 axisLabel: { show: true, textStyle: { color: 'black' //左侧字体颜色 }, }, splitLine: { show: false }, axisTick: { show: false }, axisLine: { show: false }, // data: salvProName //左侧文字显示 }, { type: 'category', inverse: true, //控制数字显示方向 axisTick: 'none', axisLine: 'none', show: true, //控制数字显示 axisLabel: { textStyle: { color: 'black', fontSize: '12' }, }, data: salvProValue //数字显示 }], series: [{ name: '值', type: 'bar', zlevel: 1, itemStyle: { normal: { barBorderRadius: 30, color: new echarts.graphic.LinearGradient(0, 0, 1, 0, [{ offset: 0, color: ' #2da5f1' }, { offset: 1, color: ' #58b7f4 ' }]), }, }, barWidth: 15, //条状图显示宽度 data: salvProValue }, { name: '背景', type: 'bar', barWidth: 15, //条状图占比宽度 barGap: '-100%', //top边距 barCategoryGap: '10%', data: salvProMax, itemStyle: { normal: { color: 'white', barBorderRadius: 30, } }, }, ] }; sechart2.setOption(option)</script><script> var sechart8 = echarts.init(document.getElementById('echart_test2')); var yData = ['铜川市', '汉中市', '西安市', '商洛市', '延安市', '榆林市', '宝鸡市', '渭南市', '咸阳市', '安康市']; var dataArr = [239, 181, 154, 144, 135, 117, 74, 72, 67, 55]; // var allDataArr = [5000, 5000, 5000, 5000, 5000, 5000, 5000, 5000, 5000, 5000]; var option = { backgroundColor: '#fff', tooltip: { show: false, trigger: 'axis', padding: [5, 5], axisPointer: { type: 'shadow' }, formatter: function(param) { return param[0].name + ":" + param[0].value } }, grid: { left: '0%', //设置左边距 right: '0%', bottom: '10%', //设置条状间距 top: '2%', //设置顶部间距 containLabel: true }, xAxis: { type: 'value', axisLabel: { show: false }, axisTick: { show: false }, axisLine: { show: false }, splitLine: { show: false }, inverse: true }, yAxis: [{ type: 'category', data: dataArr, // inverse: true, axisLabel: { color: "#000", fontSize: 12 }, axisTick: { show: false }, axisLine: { show: false } }, { type: 'category', axisTick: 'none', axisLine: 'none', show: true, axisLabel: { textStyle: { color: '#333', fontSize: 12 } }, // data: dataArr }], series: [{ name: '', type: 'bar', data: dataArr, barCategoryGap: '10%', barWidth: 15, zlevel: 1, itemStyle: { normal: { barBorderRadius: 30, color: '#ebac4b' } } }, { name: '', type: 'bar', barWidth: 15, barGap: '-100%', barCategoryGap: '10%', // data: allDataArr, itemStyle: { normal: { color: '#fff' } } }] }; sechart8.setOption(option)</script></html>- 样式图
发表评论
最新留言
网站不错 人气很旺了 加油
[***.192.178.218]2025年03月29日 23时03分09秒
关于作者

喝酒易醉,品茶养心,人生如梦,品茶悟道,何以解忧?唯有杜康!
-- 愿君每日到此一游!
推荐文章
BP神经网络学习--MATLAB源码详细注释
2021-05-08
LeetCode122.买卖股票的最佳时机2Golang版
2021-05-08
传感器驱动
2021-05-08
LeetCode 训练场:977. 有序数组的平方
2021-05-08
程序员面试金典:面试题 02.03. 删除中间节点
2021-05-08
还在花冤枉钱找人做电子签名?看这儿,教你制作纯手写电子签名
2021-05-08
Linux 文件系统分层标准(FHS)
2021-05-08
Java 知识点总结篇(2)
2021-05-08
Python 知识点总结篇(2)
2021-05-08
Python 知识点总结篇(3)
2021-05-08
如何利用 Beautiful Soup 爬取网页数据
2021-05-08
Numpy 如何操作数组
2021-05-08
Win10 环境下安装压缩包版本 MySQL-8.0.13
2021-05-08
爬取网易科技滚动新闻
2021-05-08
vuex modules
2021-05-08
react hook的使用
2021-05-08
vue父子组件传参的4种方式
2021-05-08
react 使用 useEffect 及踩坑
2021-05-08
中缀表达式转后缀表达式
2021-05-08
Java笔记:单链表
2021-05-08
白红宇的个人博客 - 记录点点滴滴的事 - 您是第 457224753 位访客
访问时间: 2025-04-16 08:39:09
访问IP: 3.137.198.249
Copyright © 2020 - 2025 css8.cn 京ICP备2021015314号-1
手机版