Matlab中legend的位置
发布日期:2021-07-01 04:03:37
浏览次数:3
分类:技术文章
本文共 2516 字,大约阅读时间需要 8 分钟。
Matlab中legend默认的位置在NorthEast,如图所示
%Matlab中legend的位置设置clcclear close allNpoint = 100;x = linspace(0,4*pi,Npoint);y1 = sin(x);y2 = cos(x);H = plot(x,y1,x,y2);legend('sin(x)','cos(x)'); 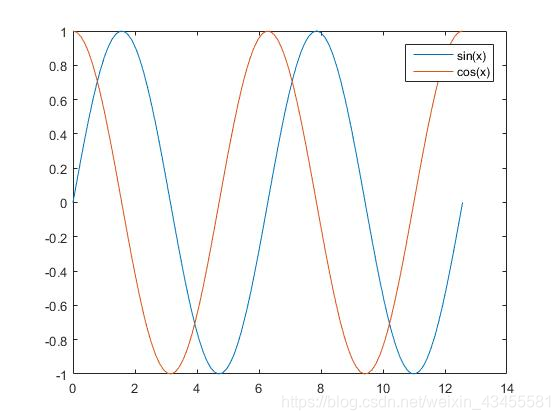
然而,我们却可以通过Location对legend的位置进行改变,变为North,如图所示
%Matlab中legend的位置设置clcclear close allNpoint = 100;x = linspace(0,4*pi,Npoint);y1 = sin(x);y2 = cos(x);H = plot(x,y1,x,y2);legend('sin(x)','cos(x)','Location','North'); 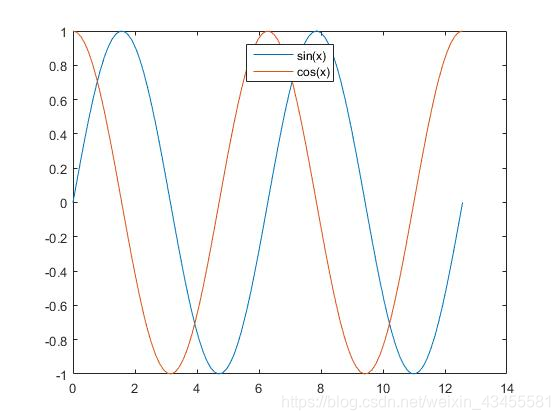
Matlab中有许多位置可以选择:
'North' inside plot box near top 'South' inside bottom 'East' inside right 'West' inside left 'NorthEast' inside top right (default for 2-D plots) 'NorthWest' inside top left 'SouthEast' inside bottom right 'SouthWest' inside bottom left 'NorthOutside' outside plot box near top 'SouthOutside' outside bottom 'EastOutside' outside right 'WestOutside' outside left 'NorthEastOutside' outside top right (default for 3-D plots) 'NorthWestOutside' outside top left 'SouthEastOutside' outside bottom right 'SouthWestOutside' outside bottom left 'Best' least conflict with data in plot 'BestOutside' least unused space outside plot
Matlab中还可以选择某条曲线legend的指定显示
%Matlab中legend的选择clcclear close allNpoint = 101;x = linspace(0,10,Npoint);y1 = besselj(1,x);y2 = besselj(2,x);y3 = besselj(3,x);y4 = besselj(4,x);y5 = besselj(5,x);H = plot(x,y1,x,y2,x,y3,x,y4,x,y5);legend('First','Second','Third','Fourth','Fifth','Location','NorthEastOutside') 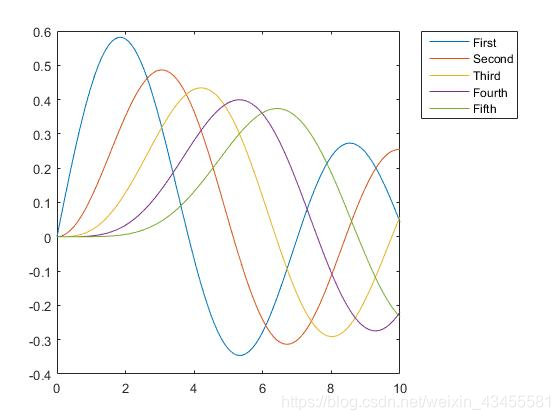
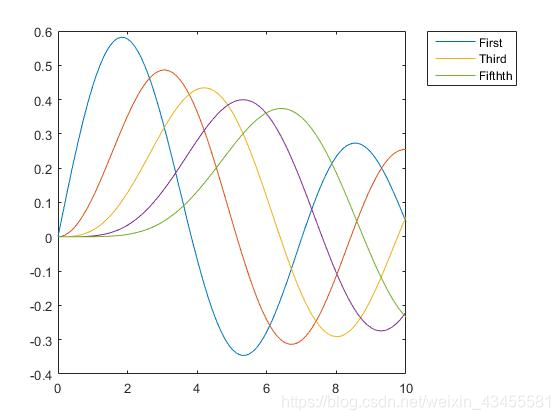
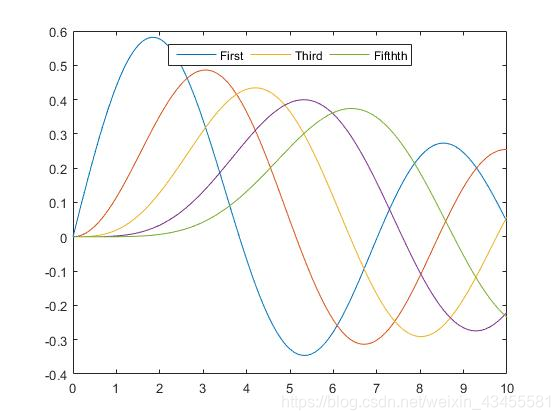
如果只想显示第1、3、5条,也很简单
%Matlab中legend的选择clcclear close allNpoint = 101;x = linspace(0,10,Npoint);y1 = besselj(1,x);y2 = besselj(2,x);y3 = besselj(3,x);y4 = besselj(4,x);y5 = besselj(5,x);H = plot(x,y1,x,y2,x,y3,x,y4,x,y5);h1 = legend(H([1 3 5]),'First','Third','Fifthth','Location','NorthEastOutside')
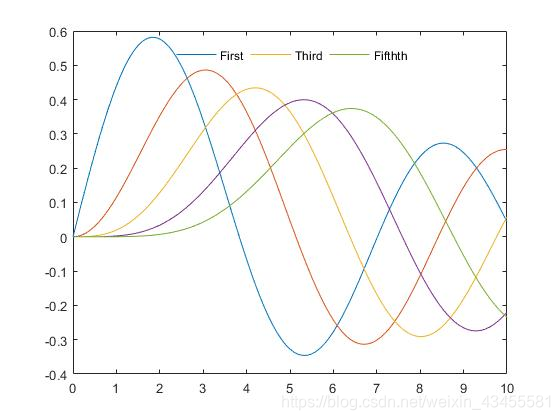
此外,还可以使用Orientation对legend进行横向排列
%Matlab中legend的横排,注意,Location位置改变为Northclcclear close allNpoint = 101;x = linspace(0,10,Npoint);y1 = besselj(1,x);y2 = besselj(2,x);y3 = besselj(3,x);y4 = besselj(4,x);y5 = besselj(5,x);H = plot(x,y1,x,y2,x,y3,x,y4,x,y5);h1 = legend(H([1 3 5]),'First','Third','Fifthth','Location','North');set(h1,'Orientation','horizon')
不显示方框:
%Matlab中legend的clcclear close allNpoint = 101;x = linspace(0,10,Npoint);y1 = besselj(1,x);y2 = besselj(2,x);y3 = besselj(3,x);y4 = besselj(4,x);y5 = besselj(5,x);H = plot(x,y1,x,y2,x,y3,x,y4,x,y5);h1 = legend(H([1 3 5]),'First','Third','Fifthth','Location','North');set(h1,'Orientation','horizon','Box','off')
转载地址:https://miracle.blog.csdn.net/article/details/115922032 如侵犯您的版权,请留言回复原文章的地址,我们会给您删除此文章,给您带来不便请您谅解!
发表评论
最新留言
关注你微信了!
[***.104.42.241]2024年04月14日 16时42分45秒
关于作者

喝酒易醉,品茶养心,人生如梦,品茶悟道,何以解忧?唯有杜康!
-- 愿君每日到此一游!
推荐文章
Python 字符编码转换要诀
2019-05-02
python: json.dumps()中的参数,数据编码格式转换
2019-05-02
Python 元组、列表、字典、文件
2019-05-02
google app engine支持https(ssl)的开发环境配置
2019-05-02
google app engine 调试方法
2019-05-02
python 的日志logging模块
2019-05-02
python各种类型转换-int,str,char,float,ord,hex,oct等
2019-05-02
Python字符串格式化
2019-05-02
C语言结构体及其成员地址的互算
2019-05-02
TCP/IP通信程序设计的丰富多样性(长短连接、同步异步等)
2019-05-02
Linux下的同步与异步
2019-05-02
TCP长连接与短连接的区别
2019-05-02
使用 libevent 和 libev 提高网络应用性能——管理多个 UNIX 网络连接
2019-05-02
Statements and Declarations in Expressions
2019-05-02
Windows 命令行下路由命令的详解
2019-05-02
pppd 中文man页面
2019-05-02
linux lsof命令详解
2019-05-02
ramfs,tmpfs, rootfs and initramfs
2019-05-02
白红宇的个人博客 - 记录点点滴滴的事 - 您是第 311714970 位访客
访问时间: 2024-05-07 13:21:09
访问IP: 18.117.196.217
Copyright © 2020 - 2023 blog.css8.cn 京ICP备2021015314号-1
手机版