本文共 5425 字,大约阅读时间需要 18 分钟。
目标
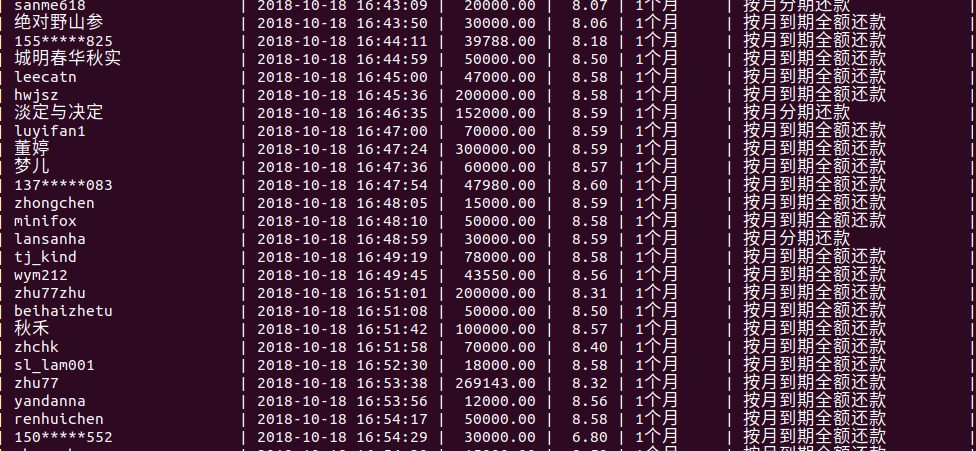
爬取红岭创投(https://www.my089.com/)日投资发标记录,存储在mysql数据库中,并将数据可视化以便分析.
行动
爬取数据
通过selenium+FIrefox的无头模式将需要的数据爬取出来,代码实现不在赘述,详细步骤可查看我的上一篇图文(),selenium3.11.0版本已经停止对phantomjs的支持,现在可以使用chrome和firefox的无头模式实现该功能.
打开无头模式:from selenium.webdriver.firefox.options import Optionsfirefox_options=webdriver.FirefoxOptions()firefox_options.add_argument("--headless")firefox_options.add_argument("--disable-gpu") 一个疑问:
使用ubuntu的crontab定时任务运行此爬虫脚本时,如果不打开无头模式,报错如下:
selenium.comm.exception.WebDriverException:message:invalid argument :can'tkill an exited process
没能理解这个报错的原因,希望与大家一起讨论.
存储数据
数据库这次选择了mysql, 首先需要建立自己的数据库,建立相应表格,这里推荐使用 Navicat,能够将数据库操作图形化.navicat需要做一些配置,网上有大量教程,建表时需要注意类型,选择正确的类型在后续使用时会减少很多麻烦,例如:
VARCHAR和CHAR类型
varchar适用场景:
- 字符串列的最大长度比平均长度大很多
- 字符串列很少被更新
- 使用了多字节字符集存储字符串(如utf8中的中文和英文)
char适用场景:
- 存储长度近似的值(md5值,如密码)
- 存储短字符串
- 存储经常被更新的字符串列
日期类型
TIMESTAMP类型:
- 以yyyy-MM-dd HH:mm:ss格式显示,占用4个字节
- 时间范围:1970-1-1 到 2038-01-19 DATATIME类型:
- 以yyyy-MM-dd HH:mm:ss格式显示,占用8个字节
- 时间范围:1000-1-1 00:00:00至9999-12-31 23:59:59
插入数据
db=pymysql.connect(host='localhost',user='root',password= 'xxxx',db='hlct',charset='utf8') sql="INSERT INTO data_1 VALUES('" + dic['借款人'] + "','" +dic['时间']\ + "','" + dic['借款金额'].replace(',', '')+ "','" + dic['利率'] +\ "','" + dic['期限'] + "','" + dic['还款方式'] + "');" cursor =db.cursor() #获取操作游标 cursor.execute(sql) #执行sql语句 db.commit() #提交到数据库执行 db.close() 此时,数据已经静悄悄的待在数据库中了 xd
利用echarts将数据可视化作图
最初我是在这学习的echarts基本操作 ------
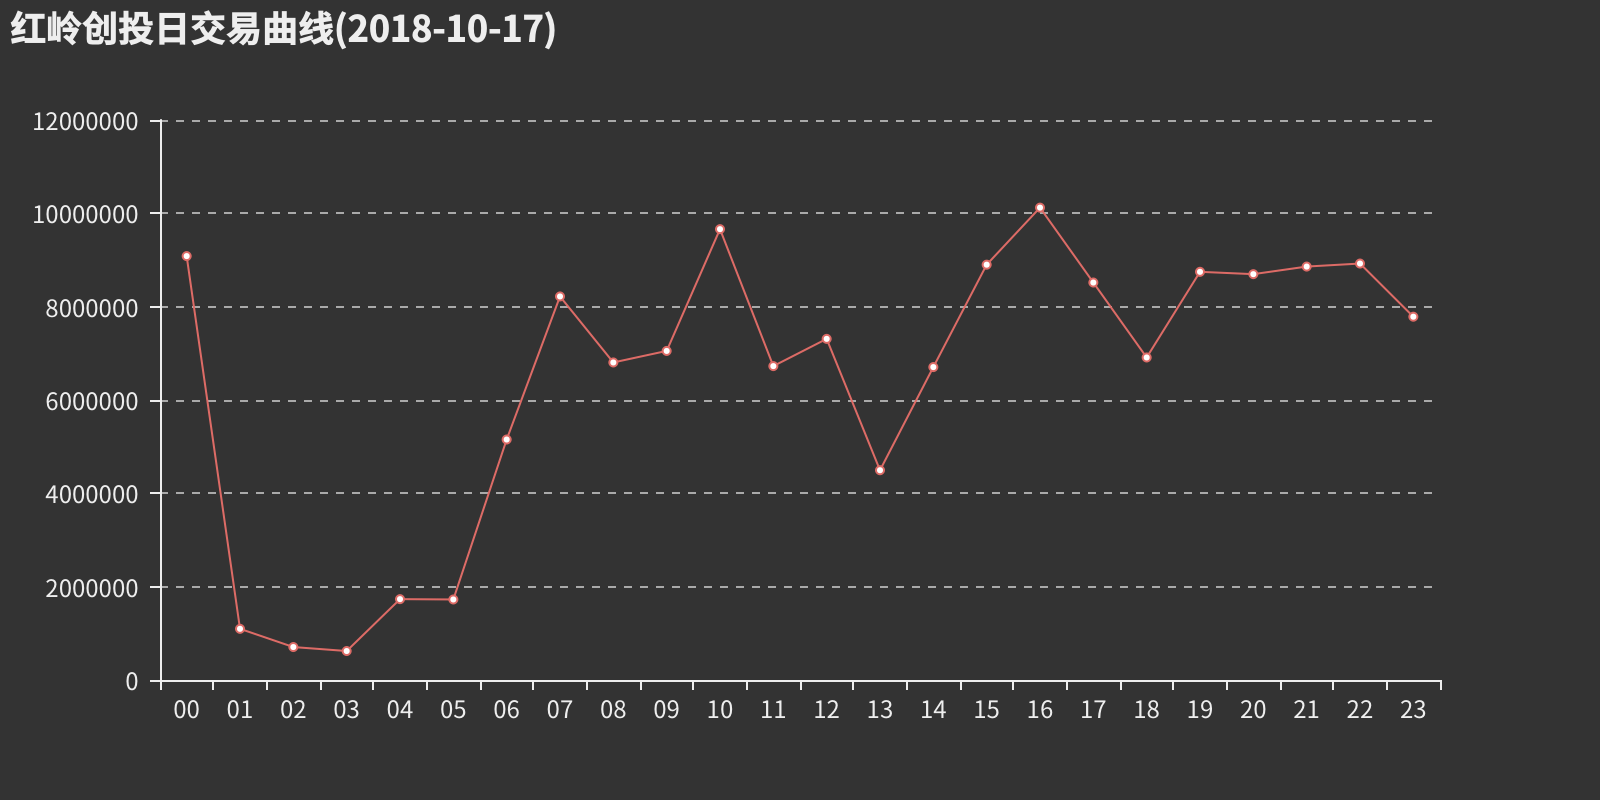
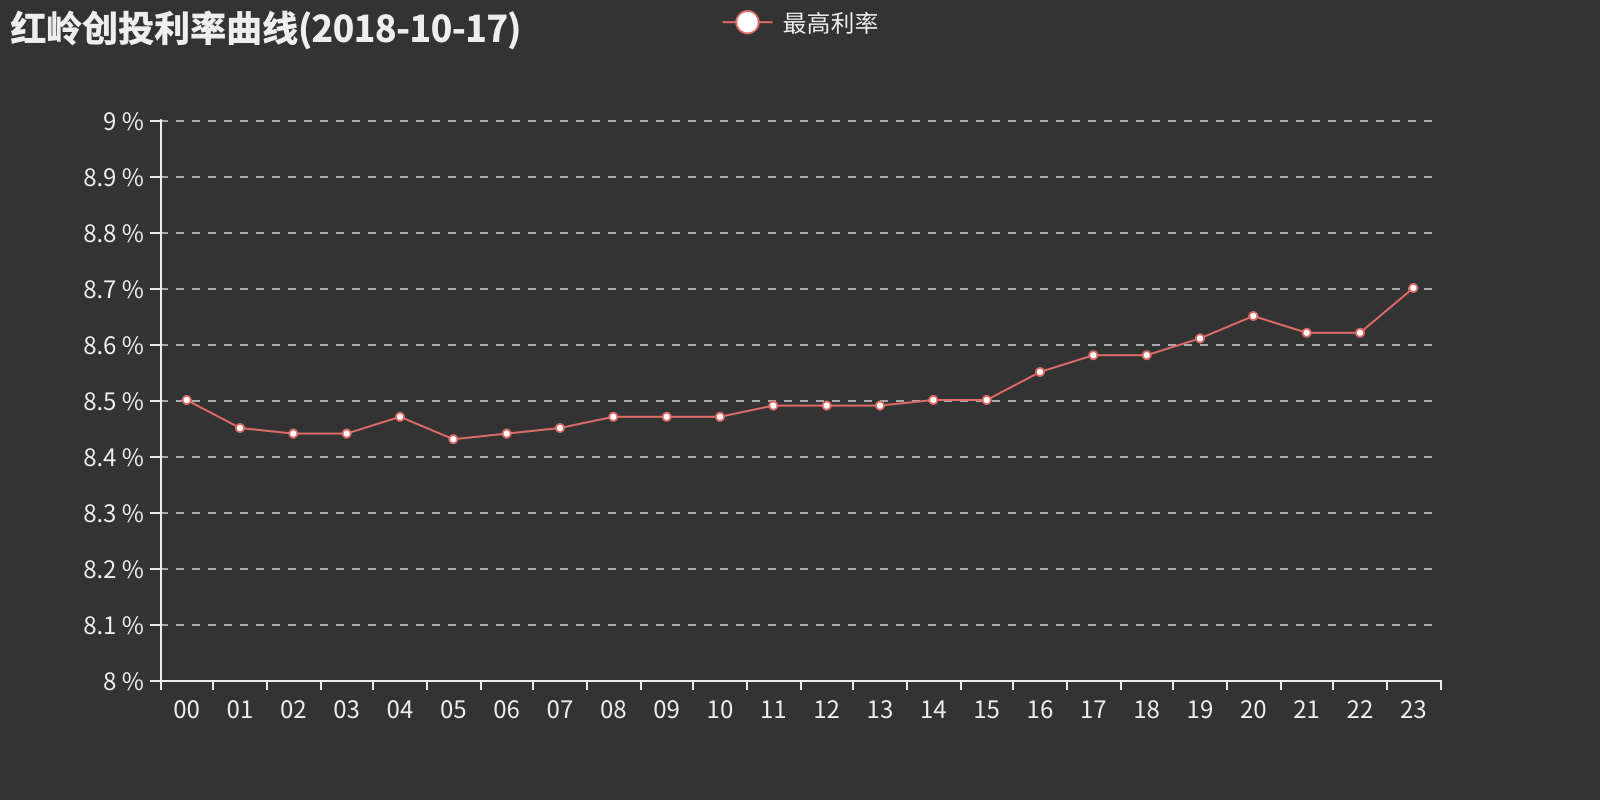
针对这次的目标,折线图是最好的展现数据方式.数据库原始数据需要做出一定处理,根据具体用途处理就好.import pyecharts_snapshotfrom datetime import datetime ,date, timedeltafrom pyecharts import Line
def rLine(y_rate): x_axis =["00", "01", "02", "03", "04", "05", "06", "07", "08", "09", "10" ,"11","12", "13", "14", "15", "16", "17", "18", "19", "20", "21","22","23"] aver=[];max=[];min=[] for y in y_rate: aver.append(y[0]) max.append(y[1]) min.append(y[2]) line = Line("红岭创投利率曲线"'('+Date+')') line.use_theme("dark") line.add("最高利率", x_axis=x_axis,y_axis=max,yaxis_max=9, yaxis_min=8,yaxis_force_interval=0.1, yaxis_formatter='%') line.render(path='/home/lsgo18/PycharmProjects/honglingchuangtou/rate.png') - x_axis--------------------------------------横轴数据
- y_axis--------------------------------------纵轴数据
- line.add()----------------------------添加数据作图
- yaxis_max--------------------设置纵轴刻度范围
- yaxis_force_interval--------------设置刻度精度
- line.use_theme--------------------------主题颜色
- line.render()------------------------------生成文件
crontab定时任务
观察了红岭创投往网站一段时间后,发现只能显示近十分钟左右的即时数据,不可能每过几分钟手动点击程序运行,伙伴们向我推荐了一个非常好用的指令-----crontab,crontab 是用来让使用者在固定时间或固定间隔执行程序之用,换句话说,也就是类似使用者的时程表,并且在后台运行,不会打扰到我们的学习和工作.
- 打开crontab:
sudo vim /etc/cronta
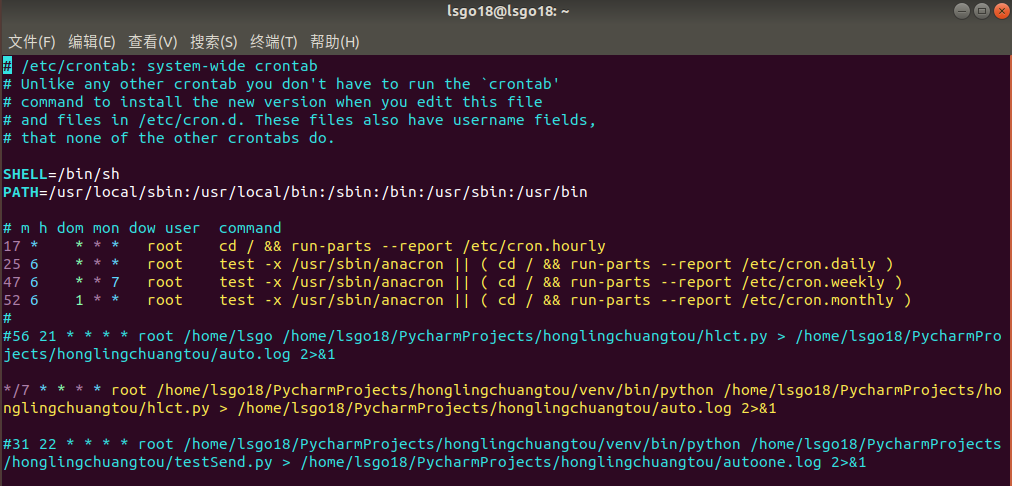
- 界面如下(通过vim打开)
基本格式
* * * * * command
分 时 日 月 周 命令
第1列表示分钟1~59 每分钟用*或者 */1表示 第2列表示小时1~23(0表示0点) 第3列表示日期1~31 第4列表示月份1~12 第5列标识号星期0~6(0表示星期天) 第6列要运行的命令 通常需要将python环境绝对路径,程序绝对路径写入命令,保证能正常运行,如果crontab没有运行,大概率的原因就在此,图中倒数第四行黄色部分就是运行爬虫的指令,最后/auto.log部分是输出日志,将每一次运行的结果写进日志文件,以便检查运行情况.smtplib发送邮件
每天处理数据做出折线图后,将图片发送给团队老大,smtplib是不错的选择,结合crontab就能每天自动运行,成就感超强.
import smtplibfrom email import encodersfrom email.header import Headerfrom email.mime.text import MIMETextfrom email.mime.base import MIMEBasefrom email.mime.multipart import MIMEMultipartfrom email.utils import parseaddr, formataddr
def send(self): from_addr = "74400xxxx@qq.com" # 发件人 Email 地址和口令 password = "xxxxxxx" smtp_server = "smtp.qq.com" # SMTP 服务器地址 to_addr = "xxxx@qq.com" # 收件人地址 # 邮件头 msg = MIMEMultipart()#代表邮件本身 msg['From'] = self._format_addr('lsgo <%s>' % from_addr) msg['To'] = self._format_addr('lsgo <%s>' % to_addr) msg['Subject'] = Header('红岭创投', 'utf-8').encode() # 标题 # 邮件正文 # msg.attach(MIMEText('……', 'plain', 'utf-8')) # 添加附件 self.addfile(msg) try: server = smtplib.SMTP(smtp_server, 25) server.set_debuglevel(1) server.starttls() server.login(from_addr, password) server.sendmail(from_addr, [to_addr], msg.as_string()) server.quit() print("邮件发送成功") except smtplib.SMTPException: self.send() print("Error: 发送邮件失败,正在重试!") 在邮件中添加附件:
def _format_addr(self,s): name, addr=parseaddr(s) return formataddr((Header(name,'utf-8').encode(),addr)) def _getfile(self): file='/home/lsgo18/PycharmProjects/honglingchuangtou/' return [file+'money.png',file+'rate.png'] def addfile(self,msg): files=self._getfile() #设置附件的MIME和文件名 attr1 = MIMEBase('image', 'png', filename='file.png') #必要的头信息 attr1.add_header('Content-Disposition', 'attachment', filename=files[0][-9:]) attr1.add_header('Content-ID', '<0>') attr1.add_header('X-Attachment-Id', '0') #读取附件内容 attr1.set_payload(open(files[0], 'rb+').read()) #用Base64编码 encoders.encode_base64(attr1) #添加到MIMEMuptipart msg.attach(attr1) # 附件2 attr2 = MIMEBase('image', 'png', filename='file.png') attr2.add_header('Content-Disposition', 'attachment', filename=files[1][-8:]) attr2.add_header('Content-ID', '<0>') attr2.add_header('X-Attachment-Id', '0') attr2.set_payload(open(files[1], 'rb').read()) encoders.encode_base64(attr2) msg.attach(attr2) 转载地址:https://blog.csdn.net/YYYYYJY/article/details/83153583 如侵犯您的版权,请留言回复原文章的地址,我们会给您删除此文章,给您带来不便请您谅解!
发表评论
最新留言
关于作者
