当我想减肥的时候,我想起用python科学建模【matplotlib]】
 好的,减肥计划已生成,可以开始锻炼减肥了。
发布日期:2021-05-07 23:08:00
浏览次数:20
分类:精选文章
本文共 1540 字,大约阅读时间需要 5 分钟。
起因
近期因疫情影响,体重居高不下,且每日都有上升的趋势。此情此景我不得不展开减肥大计。于是乎
ing
通过几篇论文的查询,得到了一些公式,将其用python建模得到代码:
import matplotlib.pyplot as pltimport matplotlibimport mathfont = { 'family' : 'MicroSoft YaHei', 'weight': 'bold', 'size': 12}matplotlib.rc('font', **font)weight = float(input('体重:'))height = float(input('身高:'))age = float(input('年龄:'))sex = input('性别:')in_k = float(input('平均每日输入卡路里:'))act = float(input('运动:'))time = float(input('运动时间:'))BMI = float(input('理想BMI:'))day = 0days = []bias = 1base = 0consumes = 0consume = 0while weight*10000/height/height > BMI:# while day < 100: need_k = 0 if sex == '男': need_k = 13.88 * weight + 4.16 * height - 3.43 * age + 54.34 else: need_k = 13.88 * weight + 4.16 * height - 3.43 * age - 58.06 consumes = consume consume = (need_k + act * time - in_k) * bias if consume < 0: print("你的摄入大于消耗,无法减肥") break if day != 0: bias = math.sqrt(consume / consumes) * bias loose_weight = consume / 7700 * 1.5 weight -= loose_weight days.append(weight) day += 1plt.figure(figsize=(20, 10), dpi=80)str_title = '你的'+str(day)+'减肥计划'plt.title(str_title)x_labels = ['{}days'.format(i) for i in range(len(days))]plt.xticks(range(0, len(days), 5), x_labels[::5], rotation=45)plt.yticks(range(40, 80))plt.plot(range(len(days)), days, label='减肥曲线', color='cyan')plt.xlabel('天数')plt.ylabel('体重')plt.grid(alpha=0.99)plt.legend()plt.savefig('loose_weight.png')plt.show() 需要注意,这里的运动是每小时消耗的热量单位【实际上原本是打算按照散步与体重等的关系建模,然鹅没找到公式】
结果
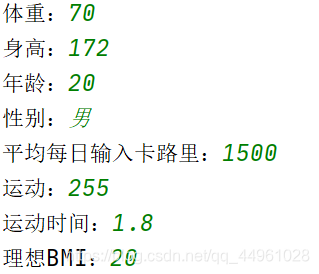
输入:
好的,减肥计划已生成,可以开始锻炼减肥了。 发表评论
最新留言
留言是一种美德,欢迎回访!
[***.207.175.100]2025年04月09日 12时14分06秒
关于作者

喝酒易醉,品茶养心,人生如梦,品茶悟道,何以解忧?唯有杜康!
-- 愿君每日到此一游!
推荐文章
【企业】走近华为,微观世界
2019-03-05
【产品】项目管理的五个过程和九大知识领域之二
2019-03-05
【项目管理】项目管理流程浅析
2019-03-05
【企业】韬盛和夫六精进
2019-03-05
【Tool】如何使用 Uniflash 烧写 WIFI 芯片 CC3200
2019-03-05
html2canvas vue页面截图生成图片地址
2019-03-05
copy_{to, from}_user()的思考
2019-03-05
Web前端安全策略之CSRF的攻击与防御
2019-03-05
5分钟快速了解下CSS4 color-adjust属性
2019-03-05
纯客户端页面关键字搜索高亮jQuery插件
2019-03-05
秋月何时了,CSS3 border-radius知多少?
2019-03-05
linux运维中常用的命令
2019-03-05
M1芯片的macbook安装王者荣耀,原神,崩坏方法
2019-03-05
CentOS7更改成阿里云的源
2019-03-05
Java温故而知新-反射机制
2019-03-05
Netty3事件处理顺序问题
2019-03-05
eclipse引用sun.misc开头的类
2019-03-05
firefox中angular2嵌套发送请求问题
2019-03-05
【Linux】service命令
2019-03-05
白红宇的个人博客 - 记录点点滴滴的事 - 您是第 457250814 位访客
访问时间: 2025-04-16 13:26:06
访问IP: 3.144.230.138
Copyright © 2020 - 2025 css8.cn 京ICP备2021015314号-1
手机版