Mandelbrot集

发布日期:2021-07-01 02:13:24
浏览次数:2
分类:技术文章
本文共 1224 字,大约阅读时间需要 4 分钟。
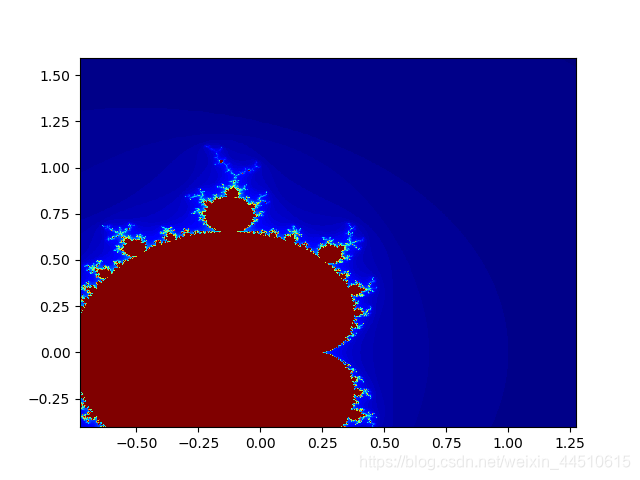
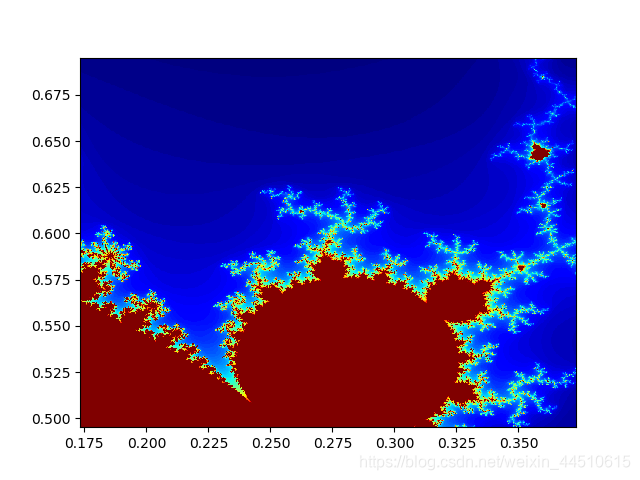
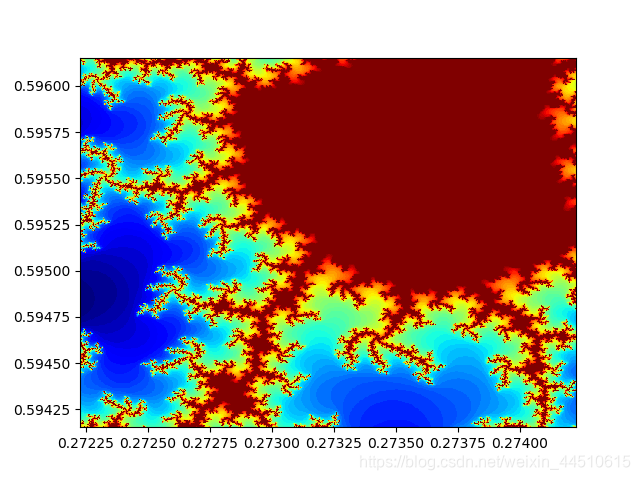
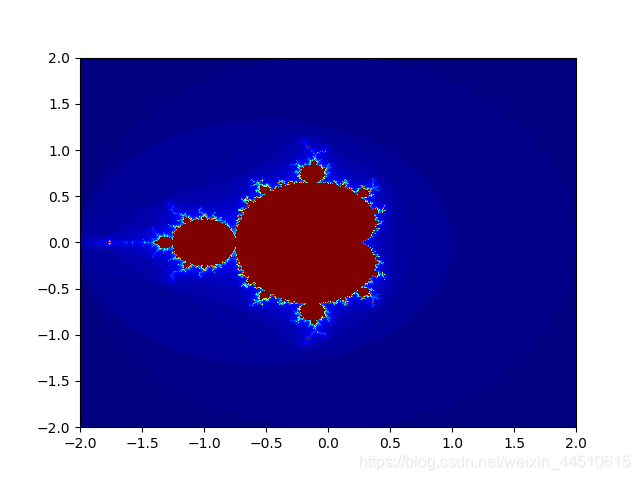
曼德勃罗特集是人类有史以来做出的最奇异,最瑰丽的几何图形,曾被称为“上帝的指纹”。 这个点集均出自公式:Zn+1=(Zn)2+C,对于非线性迭代公式Zn+1=(Zn)2+C,所有使得无限迭代后的结果能保持有限数值的复数C的集合,构成曼德勃罗集。
# /usr/bin/python# -*- coding:utf-8 -*-import numpy as npimport matplotlib.pyplot as pltimport matplotlib.cm as cmdef divergent(c): z = 0 i = 0 while i < 100: z = z**2 + c if abs(z) > 2: break i += 1 return idef draw_mandelbrot(center_x, center_y, size): x1, x2 = center_x - size, center_x + size y1, y2 = center_y - size, center_y + size x, y = np.mgrid[x1:x2:500j, y1:y2:500j] c = x + y * 1j divergent_ = np.frompyfunc(divergent, 1, 1) mandelbrot = divergent_(c) mandelbrot = mandelbrot.astype(np.float64) # ufunc返回PyObject数组 print(size, mandelbrot.max(), mandelbrot.min()) plt.pcolormesh(x, y, mandelbrot, cmap=cm.jet) plt.xlim((np.min(x), np.max(x))) plt.ylim((np.min(y), np.max(y))) plt.savefig(str(size)+'.png') plt.show()if __name__ == '__main__': draw_mandelbrot(0, 0, 2) interested_x = 0.33987 interested_y = -0.575578 interested_x, interested_y = 0.27322626, 0.595153338 for size in np.logspace(0, -3, 4, base=10): print(size) draw_mandelbrot(interested_x, interested_y, size)
转载地址:https://maoli.blog.csdn.net/article/details/89528847 如侵犯您的版权,请留言回复原文章的地址,我们会给您删除此文章,给您带来不便请您谅解!
发表评论
最新留言
路过,博主的博客真漂亮。。
[***.116.15.85]2024年05月06日 17时10分25秒
关于作者

喝酒易醉,品茶养心,人生如梦,品茶悟道,何以解忧?唯有杜康!
-- 愿君每日到此一游!
推荐文章
Python解惑之:True与False
2019-05-01
你要的微信小程序终于来了
2019-05-01
有了这些 Chrome 插件,效率提升10倍(建议收藏)
2019-05-01
Python 开发者都会遇到的错误:UnboundLocalError
2019-05-01
只有1%的程序员搞懂过浮点数陷阱
2019-05-01
一名 Google 工程师的大数据处理经验
2019-05-01
命名难,难于上青天
2019-05-01
没钱没公司,怎么做一款付费产品
2019-05-01
代码整洁之道-编写 Pythonic 代码
2019-05-01
树莓派程序开机自启动
2019-05-01
连锁门店无线通信方案
2019-05-01
配置Lotus Domino集群视频详解
2019-05-01
Linux软件万花筒
2019-05-01
全球开源软件发展趋势分析
2019-05-01
Linux常用的安全工具
2019-05-01
python 多进程之进程池的操作
2019-05-01
flask整理之 flask程序中的debug模式
2019-05-01
比特币,父母这一辈能接受吗?
2019-05-01
为什么要反对比特币,这不代表是空气币
2019-05-01
白红宇的个人博客 - 记录点点滴滴的事 - 您是第 311656575 位访客
访问时间: 2024-05-07 09:00:49
访问IP: 18.191.181.231
Copyright © 2020 - 2023 blog.css8.cn 京ICP备2021015314号-1
手机版