如何设置matplotlib中x,y坐标轴的位置?
发布日期:2021-06-30 22:51:44
浏览次数:3
分类:技术文章
本文共 1147 字,大约阅读时间需要 3 分钟。
在机器学习中经常会使用Sigmoid函数,如果直接使用matplotlib绘图,那么就会像下图这样,原点并没有在(0,0)。
import matplotlib.pyplot as pltimport numpyx = numpy.linspace(start=-10, stop=10)y = 1 / (1 + numpy.e ** (-1 * x))plt.plot(x, y)plt.title('Sigmoid')plt.show() 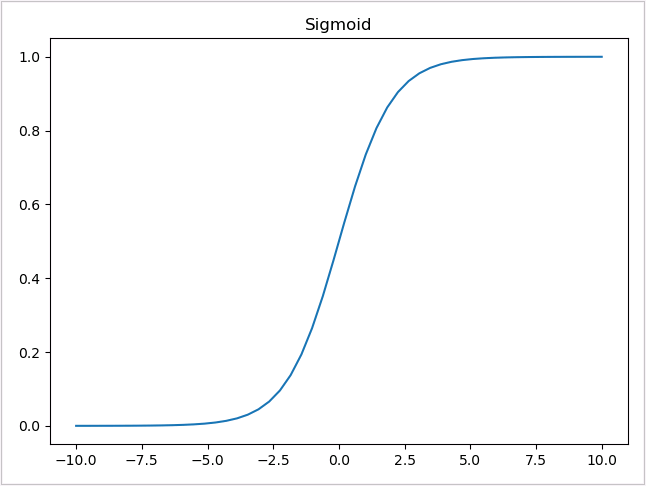
于是,我们希望调整坐标轴的位置,让图像更加的直观。
在matplotlib的图中,默认有四个轴,两个横轴(“top”、“bottom”)和两个竖轴(“left”、“right”),可以通过ax = plt.gca()方法获取,gca是“get current axes”的缩写。
先将显示的坐标图的上边框和右边框去掉,即设置它们的显示方式为不显示:
ax.spines['right'].set_color('none')ax.spines['top'].set_color('none') 注:spines译为“脊”,也就是坐标图中的边框。
将坐标图的下边框和左边框作为坐标系的x轴和y轴,并调整坐标轴的位置:
ax.spines['bottom'].set_position(('data', 0))ax.spines['left'].set_position(('axes', 0.5)) 注:设置坐标轴的位置时,“data”表示通过值来设置坐标轴的位置,“axes”表示以百分比的形式设置轴的位置。
ax.spines['bottom'].set_position(('data',0))表示将x轴设置在y=0处。ax.spines['bottom'].set_position(('axes',0.5))表示将x轴设置在y轴范围的50%处。
完整代码如下:
import matplotlib.pyplot as pltimport numpyx = numpy.linspace(start=-10, stop=10)y = 1 / (1 + numpy.e ** (-1 * x))ax = plt.gca() # 获取坐标轴ax.spines['right'].set_color('none')ax.spines['top'].set_color('none')ax.spines['bottom'].set_position(('data', 0))ax.spines['left'].set_position(('axes', 0.5))plt.plot(x, y)plt.title('Sigmoid')plt.show() 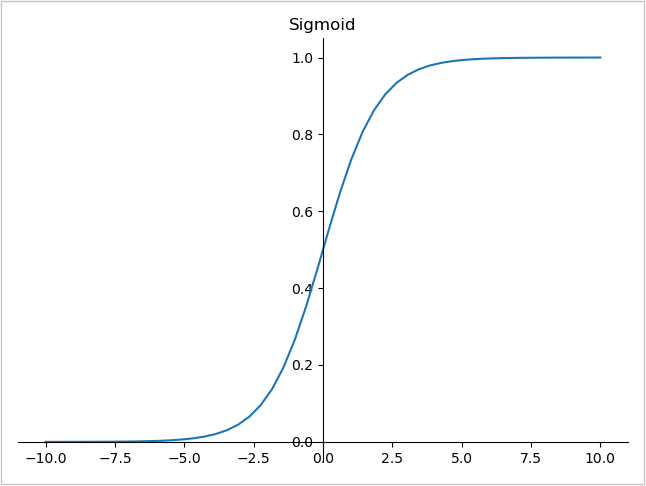
转载地址:https://lsgogroup.blog.csdn.net/article/details/117136838 如侵犯您的版权,请留言回复原文章的地址,我们会给您删除此文章,给您带来不便请您谅解!
发表评论
最新留言
留言是一种美德,欢迎回访!
[***.207.175.100]2024年04月11日 20时08分13秒
关于作者

喝酒易醉,品茶养心,人生如梦,品茶悟道,何以解忧?唯有杜康!
-- 愿君每日到此一游!
推荐文章
掌握 Python 爬虫的所有技巧,都在这里!
2019-05-01
史上最烂项目:苦撑12年,600多万行代码...
2019-05-01
关于进程与线程,史上最浅显易懂的一个简单解释
2019-05-01
别人用B站看弹幕,我用B站搞爬虫
2019-05-01
把 14 亿中国人都拉到一个微信群,在技术上能实现吗?
2019-05-01
这些代码神注释,请收下我的膝盖
2019-05-01
斯坦福后空翻机器人设计、代码全开源,成本降至3000美元,人人皆可DIY
2019-05-01
618|Python购书攻略
2019-05-01
请停止学习框架
2019-05-01
考研比惨五大专业排行榜,第一名没人不服!
2019-05-01
没钱没公司,怎么做一款付费产品
2019-05-01
Python 3.8 新特性来袭
2019-05-01
老程序员“被嫌弃”
2019-05-01
神器:公众号如何从第一篇文章开始看
2019-05-01
查询亿级数据毫秒级返回!Elasticsearch 是如何做到的?
2019-05-01
FastAPI 构建 API 服务,究竟有多快?
2019-05-01
为什么Quora选择用Python语言?
2019-05-01
一劳永逸学编程的方法
2019-05-01
代码整洁之道-编写 Pythonic 代码
2019-05-01
白红宇的个人博客 - 记录点点滴滴的事 - 您是第 311270964 位访客
访问时间: 2024-05-06 04:03:25
访问IP: 18.225.255.134
Copyright © 2020 - 2023 blog.css8.cn 京ICP备2021015314号-1
手机版