本文共 3056 字,大约阅读时间需要 10 分钟。
JVM的GC日志的主要参数包括如下几个:
-XX:+PrintGC 输出GC日志
-XX:+PrintGCDetails 输出GC的详细日志
-XX:+PrintGCTimeStamps 输出GC的时间戳(以基准时间的形式)
-XX:+PrintGCDateStamps 输出GC的时间戳(以日期的形式,如 2013-05-04T21:53:59.234+0800)
-XX:+PrintHeapAtGC 在进行GC的前后打印出堆的信息
-Xloggc:../logs/gc.log 日志文件的输出路径
在我做了如下的设置
- -XX:+PrintGCDetails -Xloggc:../logs/gc.log -XX:+PrintGCTimeStamps
以后打印出来的日志为:
- 0.756: [Full GC (System) 0.756: [CMS: 0K->1696K(204800K), 0.0347096 secs] 11488K->1696K(252608K), [CMS Perm : 10328K->10320K(131072K)], 0.0347949 secs] [Times: user=0.06 sys=0.00, real=0.05 secs]
- 1.728: [GC 1.728: [ParNew: 38272K->2323K(47808K), 0.0092276 secs] 39968K->4019K(252608K), 0.0093169 secs] [Times: user=0.01 sys=0.00, real=0.00 secs]
- 2.642: [GC 2.643: [ParNew: 40595K->3685K(47808K), 0.0075343 secs] 42291K->5381K(252608K), 0.0075972 secs] [Times: user=0.03 sys=0.00, real=0.02 secs]
- 4.349: [GC 4.349: [ParNew: 41957K->5024K(47808K), 0.0106558 secs] 43653K->6720K(252608K), 0.0107390 secs] [Times: user=0.03 sys=0.00, real=0.02 secs]
- 5.617: [GC 5.617: [ParNew: 43296K->7006K(47808K), 0.0136826 secs] 44992K->8702K(252608K), 0.0137904 secs] [Times: user=0.03 sys=0.00, real=0.02 secs]
- 7.429: [GC 7.429: [ParNew: 45278K->6723K(47808K), 0.0251993 secs] 46974K->10551K(252608K), 0.0252421 secs]
我们取倒数第二条记录分析一下各个字段都代表了什么含义
- 5.617(时间戳): [GC(Young GC) 5.617(时间戳): [ParNew(使用ParNew作为年轻代的垃圾回收期): 43296K(年轻代垃圾回收前的大小)->7006K(年轻代垃圾回收以后的大小)(47808K)(年轻代的总大小), 0.0136826 secs(回收时间)] 44992K(堆区垃圾回收前的大小)->8702K(堆区垃圾回收后的大小)(252608K)(堆区总大小), 0.0137904 secs(回收时间)] [Times: user=0.03(Young GC用户耗时) sys=0.00(Young GC系统耗时), real=0.02 secs(Young GC实际耗时)]
我们再对数据做一个简单的分析
从最后一条GC记录中我们可以看到 Young GC回收了 45278-6723=38555K的内存
Heap区通过这次回收总共减少了 46974-10551=36423K的内存。
38555-36423=2132K说明通过该次Young GC有2132K的内存被移动到了Old Gen,
我们来验证一下
在最后一次Young GC的回收以前 Old Gen的大小为8702-7006=1696
回收以后Old Gen的内存使用为10551-6723=3828
Old Gen在该次Young GC以后内存增加了3828-1696=2132K 与预计的相符
============================
"Allocation Failure" is a cause of GC cycle to kick.
"Allocation Failure" means what no more space left in Eden to allocate object. So, it is normal cause of young GC.
意思是说没法分配更多的空间给Eden区
- "[GC (Allocation Failure) ...]" - Header of the GC (Garbage Collection) message with the reason code "Allocation Failure" for the GC. So you can read this example as "A GC is performed because of Allocation Failure."
Seeing GC Allocation Failure in GC logs is totally NORMAL and not a problem by itself.
When using the Parallel GC collector/compactor, the Heap is split in between Young and Old spaces. GC Allocation failure is your case simply indicates the JVM reaches its max capacity of the YG space and now has to cleanup the short-lived objects or "garbage" from your Java application.
This situation only becomes problematic is being executed too frequently and/or taking too much time to complete given it is a stop-the-world event.
从以上解释来看Allocation Failure 只是代表年轻带不足,不是说GC产生了问题
Gc日志分析工具
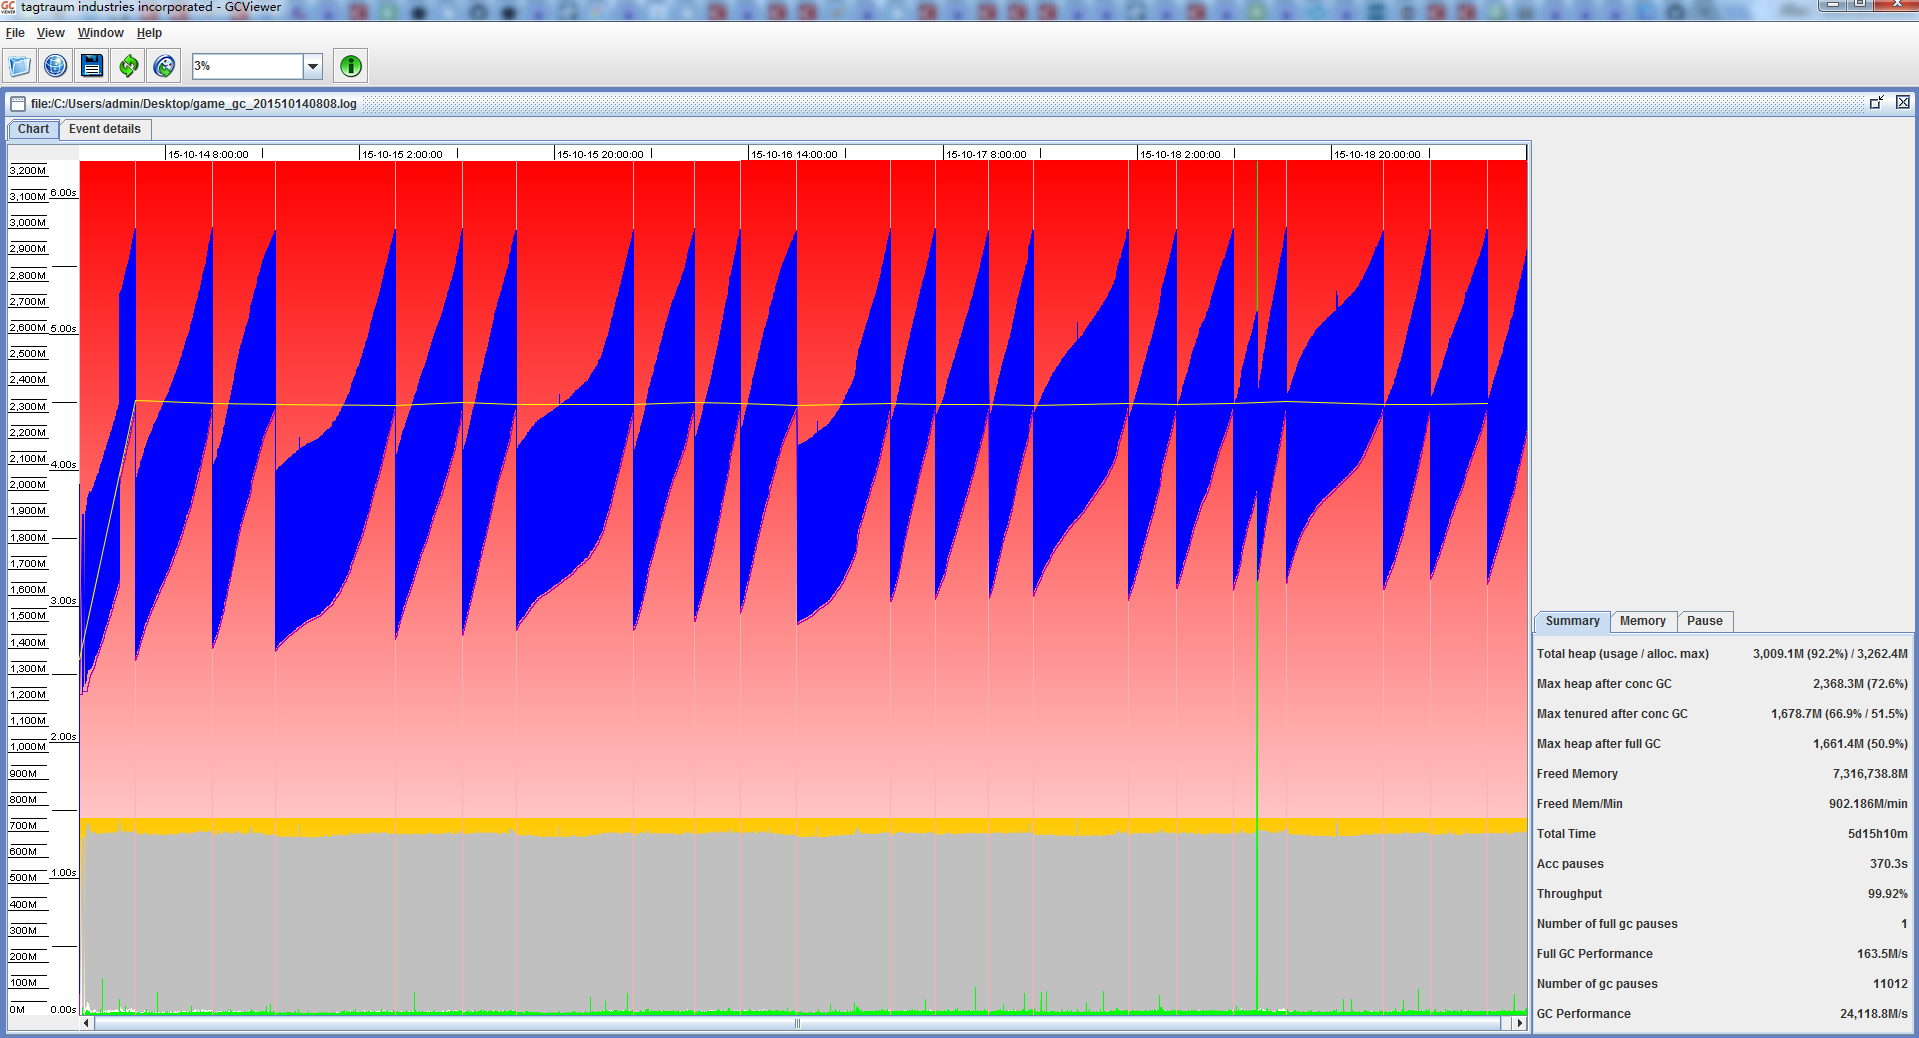
(1)GCViewer
https://github.com/chewiebug/GCViewer
中文解释:http://www.cnblogs.com/o-andy-o/p/4058271.html
其它监控方法
Jvisualvm动态分析jvm内存情况和gc情况,插件:visualGC


转载地址:https://jiangguilong2000.blog.csdn.net/article/details/48181797 如侵犯您的版权,请留言回复原文章的地址,我们会给您删除此文章,给您带来不便请您谅解!
发表评论
最新留言
关于作者
