本文共 9471 字,大约阅读时间需要 31 分钟。
文章目录
一、Spring boot 2.0 Actuator 的健康检查
官网参考:https://docs.spring.io/spring-boot/docs/2.1.3.RELEASE/reference/htmlsingle/#production-ready-health
官网 所有端点: https://docs.spring.io/spring-boot/docs/2.1.3.RELEASE/actuator-api/html/ Spring Boot 参考指南(端点) 参考URL: https://segmentfault.com/a/1190000015309478spring-boot-starter-actuator库主要用来暴露自身信息。有助于对应用程序进行监控和管理,以及采集一些应用指标。actuator通过 restful api 请求来监管、审计、收集应用的运行情况。
在Spring boot应用中,要实现可监控的功能,依赖的是 spring-boot-starter-actuator 这个组件。它提供了很多监控和管理你的spring boot应用的HTTP或者JMX端点,并且你可以有选择地开启和关闭部分功能。当你的spring boot应用中引入下面的依赖之后,将自动的拥有审计、健康检查、Metrics监控功能。
org.springframework.boot spring-boot-starter-actuator
引入上述的依赖jar;
通过下面的配置启用所有的监控端点,默认情况下,这些端点是禁用的;# actuator监控management: # server: # # 设置监控服务端口,如果没写默认就是服务器的端口 # port: 8081 endpoints: # 设置端点是否可用 默认只有shutdown可用 enabled-by-default: true web: # 设置是否暴露端点 默认只有health和info可见 exposure: # 包括所有端点 include: "*" # 注意需要添加引号 # 排除端点 exclude: shutdown endpoint: health: show-details: always #可以关闭指定的端点 shutdown: enabled: false
“*”号代表启用所有的监控端点,可以单独启用,例如,health,info,metrics等。
通过actuator/+端点名就可以获取相应的信息。
由于spring boot的版本更新比较快,配置方式可能有变化。
1. 健康检查
随时能掌握线上应用的健康状况是非常重要的,尤其是现在流行的容器云平台下的应用,它们的自动恢复和扩容都依赖健康检查功能。
想查看详细的应用健康信息需要配置management.endpoint.health.show-details 的值为always,配置之后我们再次访问http://127.0.0.1:10111/actuator/health,获取的信息如下:
{ "status": "UP", "details": { "diskSpace": { "status": "UP", "details": { "total": 250685575168, "free": 172252426240, "threshold": 10485760 } }, "redis": { "status": "UP", "details": { "version": "3.2.11" } }, "db": { "status": "UP", "details": { "database": "Oracle", "hello": "Hello" } } }} 从上面的应用的详细健康信息发现,健康信息包含磁盘空间、redis、DB,启用监控的这个spring boot应用确实是连接了redis和oracle DB,actuator就自动给监控起来了,确实是很方便、很有用。
经过测试发现,details中所有的监控项中的任何一个健康状态是DOWN,整体应用的健康状态也是DOWN。
management.endpoint.health.show-details的值除了always之外还有when-authorized、never,默认值是never。
2. 健康检查的原理
Spring boot的健康信息都是从ApplicationContext中的各种HealthIndicator
Beans中收集到的,Spring boot框架中包含了大量的HealthIndicators的实现类,当然你也可以实现自己认为的健康状态。默认情况下,最终的spring boot应用的状态是由HealthAggregator汇总而成的,汇总的算法是:
- 设置状态码顺序:setStatusOrder(Status.DOWN, Status.OUT_OF_SERVICE, Status.UP, Status.UNKNOWN);。
- 过滤掉不能识别的状态码。
- 如果无任何状态码,整个spring boot应用的状态是 UNKNOWN。
- 将所有收集到的状态码按照 1 中的顺序排序。
- 返回有序状态码序列中的第一个状态码,作为整个spring boot应用的状态。
源代码请参见:org.springframework.boot.actuate.health.OrderedHealthAggregator。
Spring boot框架自带的 HealthIndicators 目前包括:
源码搜关键字 抽象类 AbstractHealthIndicator 或接口 HealthIndicator。你可以通过management.health.defaults.enabled这个配置项将它们全部禁用掉,也可以通过management.health.xxxx.enabled将其中任意一个禁用掉。
3. 自定义 HealthIndicator 健康检查
自定义指示器继承AbstractHealthIndicator类,实现doHealthCheck方法
参考URL: https://my.oschina.net/keking/blog/3062123Actuator模块不仅会根据应用依赖和配置自动创建出来的监控和管理端点Endpoint(原生端点: health、info、beans、httptrace、shutdown等等),同时我们也可以它的基础之上扩展实现一些自定义的监控需求(自定义端点)。
-
方法一: 实现 接口HealthIndicator。
有时候需要提供自定义的健康状态检查信息,你可以通过实现HealthIndicator的接口来实现,并将该实现类注册为spring bean。你需要实现其中的health()方法,并返回自定义的健康状态响应信息,该响应信息应该包括一个状态码和要展示详细信息。例如,下面就是一个接口HealthIndicator的实现类:import org.springframework.boot.actuate.health.Health;import org.springframework.boot.actuate.health.HealthIndicator;import org.springframework.stereotype.Component;@Componentpublic class MyHealthIndicator implements HealthIndicator { @Override public Health health() { int errorCode = check(); // perform some specific health check if (errorCode != 0) { return Health.down().withDetail("Error Code", errorCode).build(); } return Health.up().build(); }} -
方法二: 自定义指示器继承AbstractHealthIndicator类,实现doHealthCheck方法
我们可以通过自定义一个类继承自AbstractHealthIndicator类来实现我们自己的健康检测。比如有这样一个例子,我们自定义一个AllDiskSpaceAbstractHealthIndicator类检测所有磁盘的磁盘信息。代码如下
/** * 通过自定义一个类继承AbstractHealthIndicator,往health端点添加数据 * * allDiskSpace2 对应的信息会在 http://127.0.0.1:2224/actuator/health 里面显示出来 */@Component("allDiskSpace2")public class AllDiskSpaceAbstractHealthIndicator extends AbstractHealthIndicator { @Override protected void doHealthCheck(Health.Builder builder) throws Exception { File[] rootFiles = File.listRoots(); if (rootFiles != null && rootFiles.length != 0) { long total = 0, free = 0; for (File file : rootFiles) { total += file.getTotalSpace(); // 总量 free += file.getUsableSpace(); // 未用 } long user = total - free; // 已用 double userRate = total == 0 ? 0 : ((double) user / total);// 利用率 builder.up() .withDetail("diskspaceTotal", total) .withDetail("diskspaceFree", free) .withDetail("diskspaceUsage", userRate * 100) .build(); } else { builder.down().build(); } }} 再通过 http://127.0.0.1:2224/actuator/health 来访问下health端点,看下我们自定义的所有磁盘容量检测是否也更随一起返回了。注意在health端点返回的数据里面查找allDiskSpace2节点对应的数据。allDiskSpace2就是 @Component(“allDiskSpace2”)里面对应的allDiskSpace2。
- 方法三: 使用@Endpoint 注解
/** * 自定义一个端点 id = diskspace 获取磁盘容量信息 */@Configuration@Endpoint(id = "diskspace") // @EndPoint中的id不能使用驼峰法,需要以-分割public class DiskSpaceEndPoint { /** * 获取自定义端点需要监测的数据 -- 磁盘容量信息 * * @return Map */ @ReadOperation public Map diskSpaceInfo() { Map result = new HashMap<>(); // 获取磁盘容量信息 File[] rootFiles = File.listRoots(); if (rootFiles != null && rootFiles.length != 0) { long total = 0; long free = 0; for (File file : rootFiles) { total += file.getTotalSpace(); // 总量 free += file.getUsableSpace(); // 未用 } long user = total - free; // 已用 double userRate = total == 0 ? 0 : ((double) user / total);// 利用率 result.put("diskspaceTotal", String.valueOf(total)); result.put("diskspaceFree", String.valueOf(free)); result.put("diskspaceUsage", String.valueOf(userRate * 100)); } return result; }} 总结: 推荐使用注解形式, 方法1、2 返回路径默认都是/actuator/health (即使用了health端点),方法3 是自定义端点,请求路径为/actuator/xxx ,xxx为你注解配置。
注意:经过测试,自定义的端口,需要如下配置,include加入你的端点id,才可以访问:
management.endpoints.web.exposure.include=diskspace
@Endpoint 注解 自定义 HealthIndicator 健康检查
SpringBoot2.0学习第六篇之Endpoint监控端点扩展
参考URL: https://www.jianshu.com/p/e17e10f4ff06推荐查本节作者URL,它有许多注解方便编码。
可以使用@Endpoint,@WebEndpoint,@JmxEndpoint,或者EndpointWebExtension来实现HTTP方式的端点,可以是传统SpringMVC也可以是最新的Spring WebFlux
@Endpoint相当于@WebEndpoint和@JmxEndpoint的整合。web和jmx方式都支持
@WebEndpoint 只会生成web的方式的端点监控默认的基础路径是/actuator,如果一个端点配置的路径是sessions,那么它的全路径就是/actuator/sessions
@WebEndpoint 就相当于声明成一个@RestController的控制类
而请求方法分别被下面注解代替。
Operation HTTP method
@ReadOperation GET @WriteOperation POST @DeleteOperation DELETEhealth的Status枚举
org.springframework.boot.actuate.health.Status.java
对多个Status的聚合
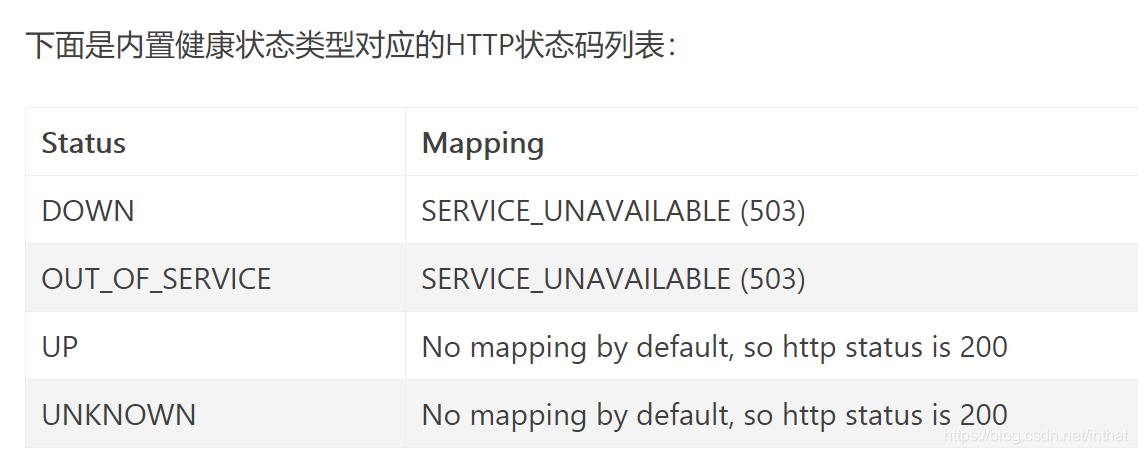
对于多个HealthIndicator的status,spring boot默认对其进行aggregrate,然后计算最顶层的status字段的值,而且对于status是DOWN或者是OUT_OF_SERVICE的,返回的http的状态码是503,这对于应用监控系统来说真是大大的贴心啊,再总结一下:
自动聚合多个HealthIndicator的status
对于status是DOWN或者是OUT_OF_SERVICE的,返回503 这样应用监控系统一来就无需去解析返回结果,直接根据http的状态码就可以判断了,非常方便。另外,除了Spring boot定义的几个状态类型,我们也可以自定义状态类型,用来表示一个新的系统状态。在这种情况下,你还需要实现接口 HealthAggregator ,或者通过配置 management.health.status.order 来继续使用HealthAggregator的默认实现。
例如,在你自定义的健康检查HealthIndicator的实现类中,使用了自定义的状态类型FATAL,为了配置该状态类型的严重程度,你需要在application的配置文件中添加如下配置:
management.health.status.order=FATAL, DOWN, OUT_OF_SERVICE, UNKNOWN, UP
在做健康检查时,响应中的HTTP状态码反应了整体的健康状态,(例如,UP 对应 200, 而 OUT_OF_SERVICE 和 DOWN 对应 503)。同样,你也需要为自定义的状态类型设置对应的HTTP状态码,例如,下面的配置可以将 FATAL 映射为 503(服务不可用):
management.health.status.http-mapping.FATAL=503
4. actuator配置 端点启用和暴露
默认情况下,除了shutdown之外的所有端点都启用了,要配置端点的启动,可以使用它的
management.endpoint..enabled
属性,下面的示例启用关闭端点:
management.endpoint.shutdown.enabled=true
如果你个人更喜欢自定义端点的启用和关闭,可以使用如下属性,
关闭所有端点启用情况,个人可以单独的通过设置enabled属性启用端点;下面的示例示关闭所有的端点,并且请用info端点:management.endpoints.enabled-by-default=falsemanagement.endpoint.info.enabled=true
默认情况下,大多数actuator的端口都不会通过http公开,* 代表公开所有这些端点。对于生产环境,应该仔细选择要公开的端点。
经过测试,自定义的端口,需要如下配置,include加入你的端点id,才可以访问:
management.endpoints.web.exposure.include=diskspace
总结:spring boot 2.1.3 经过测试,
management.endpoints.enabled-by-default=true,不配置management.endpoints.web.exposure.include可以访问health,但是management.endpoints.enabled-by-default=false,即使你配置了management.endpoints.web.exposure.include也不能访问health端点。所以,配置management.endpoints.enabled-by-default=true并且配置management.endpoints.web.exposure.include加入你要访问的端点如 health、info以及你自定义的额端点。
############################################ actuator监控# 设置监控服务端口,如果没写默认就是服务器的端口#management.server.port = 8081#management.server.address = 127.0.0.1# 设置默认端点是否可用, 默认只有health和info可见management.endpoints.enabled-by-default=true##可以关闭指定的端点#management.endpoint.shutdown.enabled=false## 配置actuator 暴露的接入点management.endpoints.web.exposure.include=diskspace,health,info# 包括所有端点#management.endpoints.web.exposure.include="*"## 排除端点#management.endpoints.web.exposure.exclude=shutdown#management.endpoint.health.show-details=always
常用端点
官网 所有端点: https://docs.spring.io/spring-boot/docs/2.1.3.RELEASE/actuator-api/html/
常用端点列举如下:
/info 应用基本信息
/health 健康度信息 /metrics 运行指标 /env 环境变量信息 /loggers 日志相关 /dump 线程相关信息 /trace 请求调用轨迹转载地址:https://docker.blog.csdn.net/article/details/105263680 如侵犯您的版权,请留言回复原文章的地址,我们会给您删除此文章,给您带来不便请您谅解!
发表评论
最新留言
关于作者
