matplotlib绘制平滑的曲线
发布日期:2022-03-18 18:19:17
浏览次数:13
分类:技术文章
本文共 1055 字,大约阅读时间需要 3 分钟。
matplotlib绘制平滑的曲线有2种常用的方法
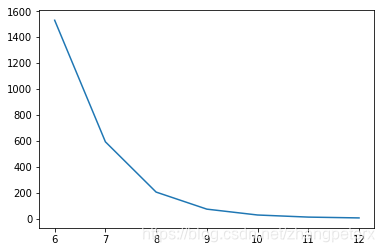
1.曲线拟合
使用scipy库可以拟合曲线.
没拟合的图:import matplotlib.pyplot as pltimport numpy as npT = np.array([6, 7, 8, 9, 10, 11, 12])power = np.array([1.53E+03, 5.92E+02, 2.04E+02, 7.24E+01, 2.72E+01, 1.10E+01, 4.70E+00])plt.plot(T,power)plt.show()
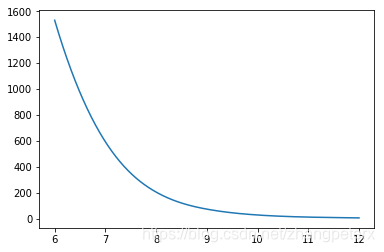
import matplotlib.pyplot as pltimport numpy as npT = np.array([6, 7, 8, 9, 10, 11, 12])power = np.array([1.53E+03, 5.92E+02, 2.04E+02, 7.24E+01, 2.72E+01, 1.10E+01, 4.70E+00])from scipy.interpolate import splinexnew = np.linspace(T.min(),T.max(),300) #300 represents number of points to make between T.min and T.maxpower_smooth = spline(T,power,xnew)plt.plot(xnew,power_smooth)plt.show()
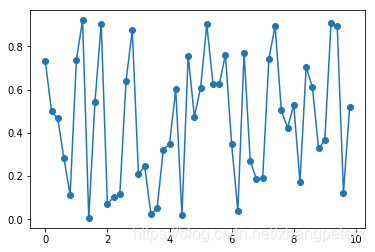
2.间隔画曲线
当matplotlib画图的横坐标为时间时,使用scipy.interpolate.spline拟合曲线就会遇到麻烦,我们可以采用间隔点画图。
原先的图:import matplotlib.pyplot as pltimport numpy as npx = np.arange(0,10,0.2)y = np.random.rand(len(x))plt.plot(x,y, marker="o")plt.show()
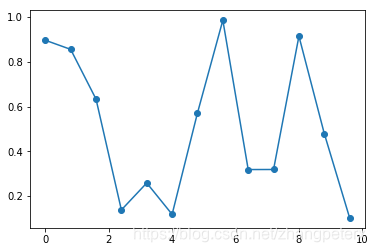
import matplotlib.pyplot as pltimport numpy as npx = np.arange(0,10,0.2)y = np.random.rand(len(x))plt.plot(x[::4],y[::4], marker="o")plt.show()
转载地址:https://zhang0peter.blog.csdn.net/article/details/83684239 如侵犯您的版权,请留言回复原文章的地址,我们会给您删除此文章,给您带来不便请您谅解!
发表评论
最新留言
关注你微信了!
[***.104.42.241]2024年04月23日 00时01分57秒
关于作者

喝酒易醉,品茶养心,人生如梦,品茶悟道,何以解忧?唯有杜康!
-- 愿君每日到此一游!
推荐文章
白红宇的个人博客 - 记录点点滴滴的事 - 您是第 307320861 位访客
访问时间: 2024-04-23 23:04:21
访问IP: 3.137.218.230
Copyright © 2020 - 2023 blog.css8.cn 京ICP备2021015314号-1
手机版