chart.js图表,饼状图,柱状图,折线图
发布日期:2022-02-17 04:52:16
浏览次数:11
分类:技术文章
本文共 2988 字,大约阅读时间需要 9 分钟。
最近项目中有用到大量的图表,所以自学下chart.js,在这里做个记录以免时间长了容易忘记。
cdn地址可以直接使用:
chart.js源码:
chart.js 英文文档:
chart.js 中文文档:
个人推荐博客园里大神总结的文档,感觉比官方的容易理解:
首先引入jq和chart.js方便操作
由于chart.js是基于HTML5的canvas,所以
项目中的饼状图:
var ctx1 = document.getElementById('myChart');var internetType = []; //上网类型 var onePercentage = []; //所占百分比var backColor1 = [] //百分比颜色for(var i = 0; ith = data.actiontype.length, i < ith; i++){internetType.push(data.actiontype[i].type);onePercentage.push(data.actiontype[i].percent); backColor1.push('#FF6384','#36A2EB','#FFCE96','#FFCE00','#36E2EB','#838B2E','#B2E6C3','#DCB4B8','#9FC3F7');} var myChart1 = new Chart(ctx1,{ type:'pie', data:{ labels: internetType, //矩形标题 datasets:[{ data: onePercentage, //所占整圆的比例 backgroundColor:backColor1, //背景色 hoverBackgroundColor:backColor1 }] } }); 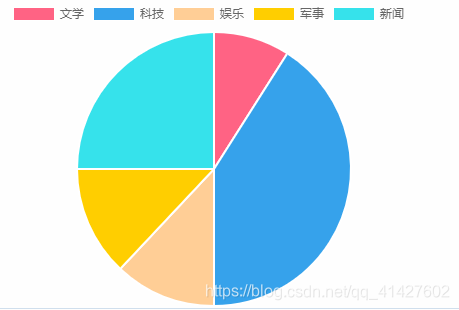
柱状图和折线图写法基本一样只需改变type:的值;
柱状图:type:bar;
折线图:type:line;
如果需要一些别的基本的配置,可以修改默认的参数:
var options = { //Boolean - If we show the scale above the chart data //是否显示柱状图上面的数据 scaleOverlay: true, //Boolean - If we want to override with a hard coded scale scaleOverride: false, //** Required if scaleOverride is true ** //Number - The number of steps in a hard coded scale scaleSteps: null, //Number - The value jump in the hard coded scale scaleStepWidth: 50, //Number - The scale starting value scaleStartValue: null, //String - Colour of the scale line //x/y轴坐标线的颜色 scaleLineColor: "rgba(0,0,0,.1)", //Number - Pixel width of the scale line //坐标线的宽度 scaleLineWidth: null, //Boolean - Whether to show labels on the scale //是否显示label值 scaleShowLabels: true, //Interpolated JS string - can access value scaleLabel: "<%=value%>", //String - Scale label font declaration for the scale label //字体Family scaleFontFamily: "'Arial'", //Number - Scale label font size in pixels //字体大小 scaleFontSize: 12, //String - Scale label font weight style //字体样式 scaleFontStyle: "normal", //String - Scale label font colour //字体颜色 scaleFontColor: "#666", ///Boolean - Whether grid lines are shown across the chart scaleShowGridLines: false, //String - Colour of the grid lines //网格线颜色 scaleGridLineColor: "rgba(0,0,0,.05)", //Number - Width of the grid lines scaleGridLineWidth: 1, //Boolean - If there is a stroke on each bar barShowStroke: true, //Number - Pixel width of the bar stroke barStrokeWidth: 2, //Number - Spacing between each of the X value sets // 柱状块与x值所形成的线(如:x=20这条线)之间的距离 barValueSpacing: 5, //Number - Spacing between data sets within X values // 在同一x值内的柱状块之间的间距 barDatasetSpacing: 1, //Boolean - Whether to animate the chart animation: true, //Number - Number of animation steps animationSteps: 60, //String - Animation easing effect animationEasing: "easeOutQuart",}
转载地址:https://blog.csdn.net/qq_41427602/article/details/84316198 如侵犯您的版权,请留言回复原文章的地址,我们会给您删除此文章,给您带来不便请您谅解!
发表评论
最新留言
初次前来,多多关照!
[***.217.46.12]2024年04月03日 21时04分57秒
关于作者

喝酒易醉,品茶养心,人生如梦,品茶悟道,何以解忧?唯有杜康!
-- 愿君每日到此一游!
推荐文章
printf与scanf的用法知识(C Primer Plus总结)
2019-04-26
三目运算符(条件运算符)
2019-04-26
C语言中的goto语句
2019-04-26
欧几里德算法及拓展
2019-04-26
CSDN-markdown编辑器基本用法
2019-04-26
等差数列公式搜集
2019-04-26
复合字面量(compound literal)
2019-04-26
gets和puts
2019-04-26
fgets、gets_s和fputs
2019-04-26
解决centos7联网问题
2019-04-26
c字符串函数
2019-04-26
nyoj1328派队方案
2019-04-26
nyoj322Sort归并排序
2019-04-26
nyoj1235A/B Problem逆元
2019-04-26
nyoj1270 care for China记忆化搜索
2019-04-26
linux常用命令
2019-04-26
快速排序qsort
2019-04-26
nyoj42一笔画问题欧拉图
2019-04-26
nyoj880还是打印菱形
2019-04-26
第八届蓝桥杯第4题:方格分割
2019-04-26
白红宇的个人博客 - 记录点点滴滴的事 - 您是第 306221046 位访客
访问时间: 2024-04-19 14:21:45
访问IP: 3.141.202.187
Copyright © 2020 - 2023 blog.css8.cn 京ICP备2021015314号-1
手机版